Using The Histogram
A lot of people who have come to our workshop have heard me talking about the “Histogram” and just how useful a tool it can be in getting your exposures spot on just the way that you want them.
So what is the Histogram?
To put it simply the Histogram is a graphic representation of the exposure value for an image which at a glance can indicate any problems with the exposure.
Why not just look at the picture review on the screen?
On most cameras the back screen can be controlled to a degree, for example the brightness can be changed, which can lead to an inaccurate view of the exposure. The Histogram on the other hand will remain unchanged no matter how the screen is set up and will always give an accurate reading.
Where do I find it?
On many camera you now need to enable the histogram in the camera menu with some manufacturers giving you the choice of RGB or Brightness. RGB gives you a view of the reds, greens and blues as individual graphs, Brightness gives you the combined overall exposure on one graph which is simpler and perfectly adequate.
To bring up the Histogram on most camera press the play button to bring up one of the photos on the display screen then press the “Info” button to cycle through the different information available on that image.

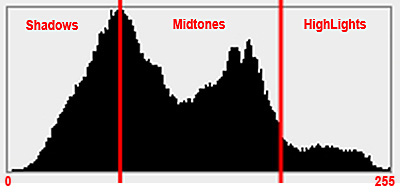
The Histogram
If that doesn’t bring it up you might need to have a quick look in the camera’s hand book.
How does it work?
The Histogram is made up of 256 bars or stacks, which run through the levels of brightness found in the image. Stack 0 corresponds to black, stack 255 to white, with 254 levels of gray in between. These gray stacks are where the picture detail can be found, where as pure black or pure white would indicate loss of detail. The height of each stack is determined by the number of pixels that share that level of brightness.
As the stacks run from Black to White we can see that the histogram can be divided up into Shadows, Mid-tones and Highlight areas. A well-balanced histogram would show the image brightness spread out from black to white with the highest stacks being spread across the mid tones.
Reading the Histogram
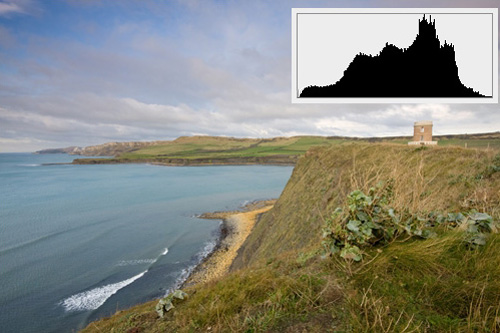
These images are general images where the image is mainly composed of an even distribution of tones, with nothing that really dominates the image. Later we will show you what happens when an element of the picture dominates the exposure.

Well Balanced Correct Exposure
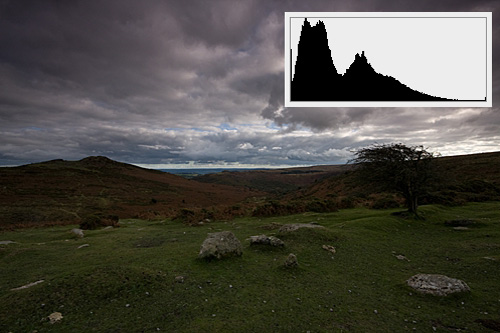
If the image were under exposed the histogram would show a bias towards the shadows at the left, here we see that the majority of the image is stacked towards the shadows meaning that the image will be on the dark side. We can see on the histogram where the image has caused stack 0 (black) to have a tall spike, meaning that the image has lost detail in those pixels. This loss of detail is called “clipping” and can occur at both ends of the histogram.

Under Exposed
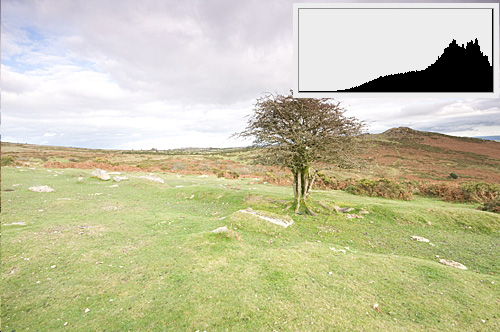
If we go the other way and over expose the picture we end up with the stacks being moved over to the right or highlight side. Again we can see that the right side ends in a spike of white pixels where clipping has occurred and detail lost, although this time to white.

Over Exposed
Reading The Picture
The last three examples have been of balanced scenes where there are a lot of mid-tones and nothing that dominates the picture. Sometimes it is not quite as simple as that, for example shooting on a white background.
Here we already know that the background really is flat white and featureless with no detail, and so we expect it to be clipped, after all it really is white. The important bit to look for is the mid tones where the detail is and make sure that they are spread evenly whilst ignoring the white.
Reading this image we can see a few areas that are really black the eye pupil and maybe under part of the tail shadow, they would give the spikes at the dark end. You then get an even spread of tones across the greens and browns with the majority being almost central, and then the big spike of white from the background.

White Background
We can also go the other way, this time shooting on a very dark background, where as expected we see a big spike in the shadows with the owl only occupying a small fairly evenly distributed tone curve across the graph.

Dark Background
So, as we have seen the Histogram is a great tool for showing you instantly how bright or dark your exposure really is, but, when using it you have to take into account not just the Histogram itself but also what your photo is of.
As you become more familiar with reading your Histograms you will be able to tailor your shooting to get your exposure as right as possible in camera, saving time later in post processing as well as giving you more leeway to adjust and tweak your images. A common example of this is “shooting to the right” where the image is exposed with a bias to the right side of the histogram (the Light Side) which will give you slightly more detail in the shadows to play with in your chosen RAW software package.

